Ever wondered what lies beneath your feet? Not your basement or the local subway station—but deep underground. What type of rock is under your neighborhood? Is it ancient granite or soft sediment? Now, thanks to the United States Geological Survey (USGS), you can finally find out with a new interactive map that opens a whole new window into the Earth’s history.
Launched just this past August, this digital map brings together geological data from across the continental U.S., making it the most comprehensive underground map ever made available to the public. From scientists to curious students, anyone can now look into the hidden layers of the planet—right from their screen.
Table of Contents
History

This incredible tool is the result of years of work led by geologist Joseph Colgan, who aimed to unify more than 100 regional maps into a single, user-friendly platform. His mission? Make geology understandable and accessible for everyone—from seasoned researchers to everyday citizens.
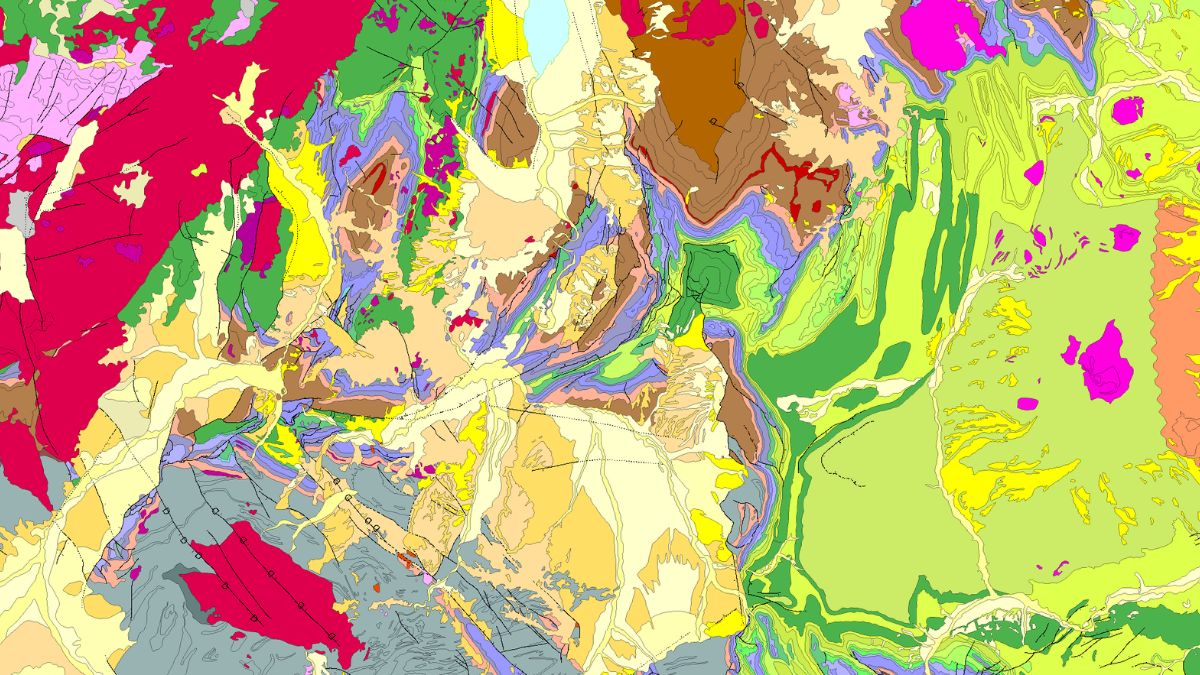
Each color on the map represents a different geological era or material. You can see where ancient rivers once flowed, where mountains once rose, and even spot seismic fault zones just by clicking on a point.
Details
So, what exactly does this map show?

It breaks down the composition and age of underground materials, from recent sands to billion-year-old bedrock. Using detailed layers, it goes as far back as the Precambrian era, which dates to more than 540 million years ago.
Here’s a quick look at what the map includes:
| Feature | Description |
|---|---|
| Geological Layers | Shows rock types and formations across regions |
| Color Coding | Indicates different ages and material compositions |
| Historical Timelines | Goes back to Precambrian times |
| Risk Identification | Maps out earthquake zones, landslides, etc. |
| Resource Mapping | Highlights areas rich in minerals or groundwater |
It’s more than a map—it’s a time machine that lets you peer into the planet’s ancient past.
Use

While this may sound like a geeky science project, the map has real-world value for nearly every industry.
Urban planners can use it to decide where to build safely.
Engineers can use it to avoid unstable ground.
Geologists can identify areas with rich mineral deposits.
Farmers and water managers can assess aquifers for better irrigation planning.
Even oil and energy companies can spot potential exploration zones.
In the words of Christopher Swezey, a coordinator for the USGS mapping program:
“Geological maps help identify energy, mineral, and water resources, as well as assess risks such as earthquakes or landslides.”
Tech
What makes this project groundbreaking isn’t just the data—it’s how it’s delivered.
Before, creating or updating geological maps took months or years. Now, with this digital platform, the USGS can standardize and update maps in real-time, integrating them into a national database with live editing capabilities.
According to Sam Johnstone from the USGS team:
“We can now update the national map faster than ever.”
Plus, it’s mobile-friendly, easy to use, and totally free. You can zoom in on your town, click a spot, and instantly learn what’s beneath it—whether it’s volcanic rock, ancient sandstone, or something in between.
Value
Beyond its scientific cool factor, geological mapping is big business. For every $1 spent on geological mapping in the U.S., it returns $7 to $10 in economic value. This includes:
- Fewer construction errors
- Better land-use planning
- Safer public infrastructure
- Smarter mining and resource extraction
It also plays a huge role in disaster prevention. Imagine knowing that a school is being built on a fault line—or not knowing. This map helps prevent costly and dangerous mistakes before they happen.
Access
You can check out the map right now on the official USGS website. Just visit usgs.gov and dive into the interactive tool.
Features include:
- View by rock type or age
- Click any location for full geological data
- Switch between time periods
- Download raw data for research or school projects
- Link the map to GIS programs for advanced use
Currently, it covers all 48 continental U.S. states, but don’t worry—Alaska, Hawaii, and U.S. territories are coming soon.
Whether you’re a student, teacher, builder, or just someone who loves learning new things, this is a powerful way to connect with the Earth’s history—and it’s all just a few clicks away.
FAQs
What is the USGS interactive map?
It’s a digital tool that shows U.S. geological layers and rock types.
Who can use this map?
Anyone—scientists, students, engineers, or the general public.
Is the map free to access?
Yes, it’s completely free on the official USGS website.
What states are covered?
All 48 continental states, with more regions coming soon.
How accurate is the data?
It’s based on updated, real-time geological surveys.